Explain Mode: Understanding, Chunk by Chunk
This is where learning actually happens. Not memorization. Not skimming. Understanding — the kind that stays.
BI, Statistics, and Oversight Outputs
Beyond individual cases, the materials note FIUs must produce organizational outputs: annual statistics, compliance reporting, performance dashboards, and management information.
Operational and management reporting — statistics, dashboards, and compliance/performance information used for oversight.
| Output type | What it summarizes | Decision it supports |
|---|---|---|
| Annual statistics | Totals/volumes over a year | External reporting |
| Compliance reporting | AML/CFT expectations | Consistent controls |
| Performance dashboards | Workloads, processing times | Managing bottlenecks |
What Are Bite-Sized Chunks?
When you open a sub-topic in Explain Mode, the AI doesn't hand you a wall of text. It breaks the material into small, focused chunks — each one teaching a single concept. You move through them one at a time, at your own pace.
This approach is based on cognitive load theory: your brain processes information more effectively in small, organized pieces rather than long, unstructured blocks.
Interactive Elements
Charts & Visualizations
Complex relationships — data trends, comparisons, structures — are rendered as interactive charts powered by professional visualization libraries. These aren't decorative images; they're tools for understanding. Hover, zoom, and explore the data behind the concept.
Smart Callouts
Key definitions, warnings, and important distinctions appear in highlighted callout boxes. These draw your attention to the information that matters most — the details that separate someone who "kind of gets it" from someone who truly understands.
Code Examples
For technical and programming topics, Explain Mode includes syntax-highlighted code examples with annotations. Each code block is paired with a plain-language explanation so you see both the "what" and the "why."
Knowledge Checks
At the end of each chunk, you'll encounter a quick knowledge check — a question or prompt that asks you to apply what you just read. This isn't a formal quiz; it's a checkpoint to make sure the concept landed before you move on.
If you get it right, you proceed with confidence. If not, the AI clarifies the gap immediately. No waiting, no confusion accumulating in the background.
Which option best matches the materials' distinction between operational intelligence and strategic intelligence?
Moving Through a Sub-Topic
Progress through each chunk at your own speed. The AI tracks where you are, so you can close the app and pick up exactly where you left off. No bookmarks, no lost progress.
Once you've worked through all the chunks and passed the knowledge checks, that sub-topic is marked as explained. From here, you're ready for Quiz Mode to prove real mastery.
Going Deeper: Explain Further, Simplify & Visualize
Below each chunk, up to three buttons are available — Explain Further, Simplify, and Visualize (shown on chunks that contain charts). These are instant, on-demand responses that appear inline without advancing your session.
Explain Further
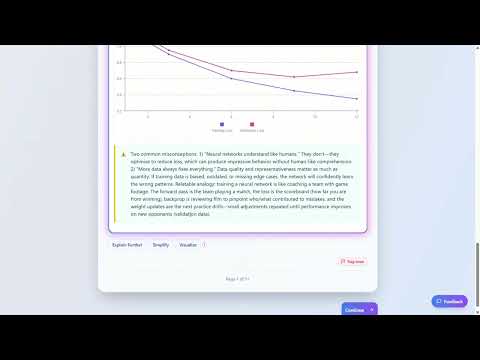
Tap Explain Further for more depth: a step-by-step breakdown, real-world examples, analogies, or a closer look at common misconceptions. The result appears in a highlighted frame directly below the chunk.
Simplify
Tap Simplify to get the same idea rewritten in shorter sentences and simpler vocabulary — useful when the original explanation feels too dense or technical.
Visualize
Tap Visualize on chunks that contain a chart to generate an AI-created schematic image of the concept. The image is tailored to your topic's language and your learning level, and appears in the same highlighted frame alongside your Explain Further and Simplify results. You can tap Visualize multiple times — each attempt adds a new image to your navigable history. Each Visualize call deducts 250 credits.
Click as Many Times as You Need
Each click sends the AI the original chunk plus the full history of previous responses. On the 3rd attempt and beyond, the AI switches to a completely different teaching approach — a story, analogy, real-world scenario, or first-principles breakdown — instead of rephrasing the same content.
Use the ◀ / ▶ arrows in the result header to navigate between your attempts. The full history persists while you move between chunks in the same session.